


At ThinkCERCA, we know how important data is for driving instructional decisions. Our latest reporting enhancements were built with educators and administrators in mind—to make finding, analyzing, and acting on student data faster and easier than ever before. We’re excited to introduce a refreshed and powerful reporting experience designed to make data exploration faster, more intuitive, and more meaningful for educators. Whether you’re tracking student progress, comparing classrooms, or diving into detailed analytics, our new reports are built to help you do it all,quickly and with ease.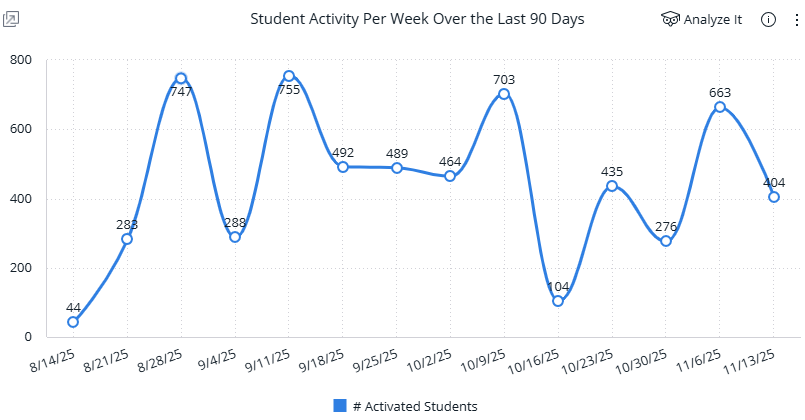
⚡ Lightning-Fast Loading
The first thing you’ll notice? Speed. Reports now load significantly faster, and visualizations populate almost instantly. This means less time waiting and more time focusing on insights that matter for your students and schools. Whether you’re tracking student progress, comparing classes, or identifying growth opportunities, you can access the information you need without delays, which help you focus more on teaching and learning, and less on waiting for data to load.
🧭 A Cleaner, More Intuitive Design
The new Reports tab serves as your main landing page, providing seamless access to all available reports. If you are in a report and want to go back to the main landing page to view more, just click on the reports tab. The filter panel now appears on the right side of the screen, making it easier to refine data without losing sight of the visuals. The panel is collapsible and expandable, letting you increase white space and stay focused on what matters most—your insights. Each chart includes a small arrow indicator signaling that drill-down data is available with just one click.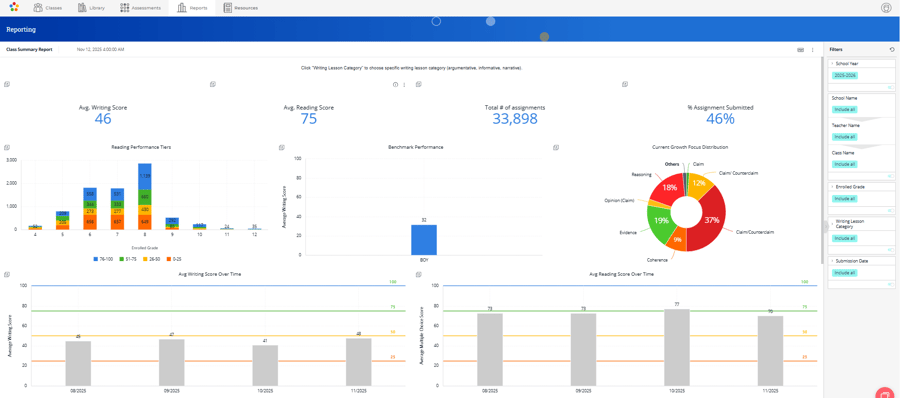
🎯 Enhanced Comparison Capabilities with Smarter Filtering Options
Filters are now more powerful and flexible. We’ve upgraded the filters to make comparisons across multiple schools or classes simpler and more efficient, without having to reapply filters repeatedly. New reports allow for easy side-by-side comparisons. With greyed-out filters and persistent options on the right-hand panel, users can quickly toggle between different schools, teachers, or classes all within the same view.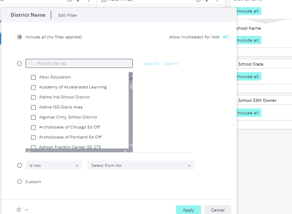
Choose to include or exclude specific schools, teachers, or classes to customize your view. Once specific filters are selected, you can deselect options to compare within the selected group. The deselected options appear greyed out, helping you easily visualize comparisons. If all options are deselected, you’ll automatically return to the total or all-data view. These features make it easy to compare schools or classrooms side-by-side without repeatedly adjusting filters, ultimately saving you time and improving your workflow.
🔍 Dynamic Drill-Down Features
Want to explore student-level data? Click any chart or number with an arrow to drill down into detailed insights. Every chart or key metric now includes a small arrow indicator, signaling that drill-down data is available. 
Click on a chart or number to view more granular information—right down to student-level data. Additionally, you can customize the number of rows that you want to see on page (15, 25, 50, or 75). You can also sort any column in ascending or descending manner to look at the data. Download the data as Excel, PDF, or CSV directly from the menu in the upper right corner for deeper review or sharing. In some cases, the downloadable version may differ slightly from the visualized report to make it more analysis-friendly in Excel. Some downloads are optimized for Excel to make deeper analysis even easier.
🖨️ Seamless Downloading and Data Sharing Options
Need to share insights? You can download individual visuals or tables (as Excel, CSV, or PDF) or entire reports using the three-dot menu in the top-right corner. When downloading as a PDF, you can customize paper size (recommended: A3 for larger reports), orientation (Landscape for wide visuals), and other header details and layout settings. If text doesn’t appear fully visible, adjusting the paper size and orientation will ensure a clean and complete report display and better visibility. Sharing reports with your team has never been simpler. Use the three-dot menu on the top-right of any report to download the entire report or specific visuals.
⏰ Report Scheduling – Coming Soon!
We’re also working on a report scheduling feature that will let you automatically receive reports at your preferred frequency or send it to your team. If you’ve previously scheduled reports and need help transitioning them to the new system, please reach out to your Success Manager or contact us at support@thinkcerca.com.
At ThinkCERCA, we’re committed to making data more actionable, accessible, and empowering, because when educators have better tools, students have better outcomes. These updates are designed to make your data work harder for you,so you can focus on what matters most: student growth and instructional impact.
Explore the New Reports
Log in to your ThinkCERCA account today and explore the new reporting experience. It’s faster. It’s smarter. It’s built for you.